Any tool can draw an org chart. The real question is a different one: who decides in this unit – and who confirmed it?
The trouble with drawn org charts
In most projects the org chart exists twice. Once as a slide someone built six months ago, and once as knowledge in people’s heads. The slide shows boxes with names. It does not show whether the person knows about it, since when they are responsible, and what happens when they leave the project.
As long as only boxes are drawn, the real question stays unanswered. You cannot search a picture, cannot check it, and cannot have it confirmed.
What we built instead
In TAOM Process Studio the project organisation is a model, not a picture. You maintain units, levels and people – the org chart is computed from that: levels, connections, boxes, person rows.
The difference in one sentence: you don’t maintain the picture, you maintain responsibility – the picture follows from it.
RACI on the box, not in a side table
Every assignment carries a role:
A accountable – carries the responsibility, exactly once per object
R responsible – may occur several times
C consulted – is asked, but does not decide
I informed – learns the outcome
These letters sit in the box, in the colour of their role. Anyone looking at the chart sees straight away where an A is missing.
See for yourself
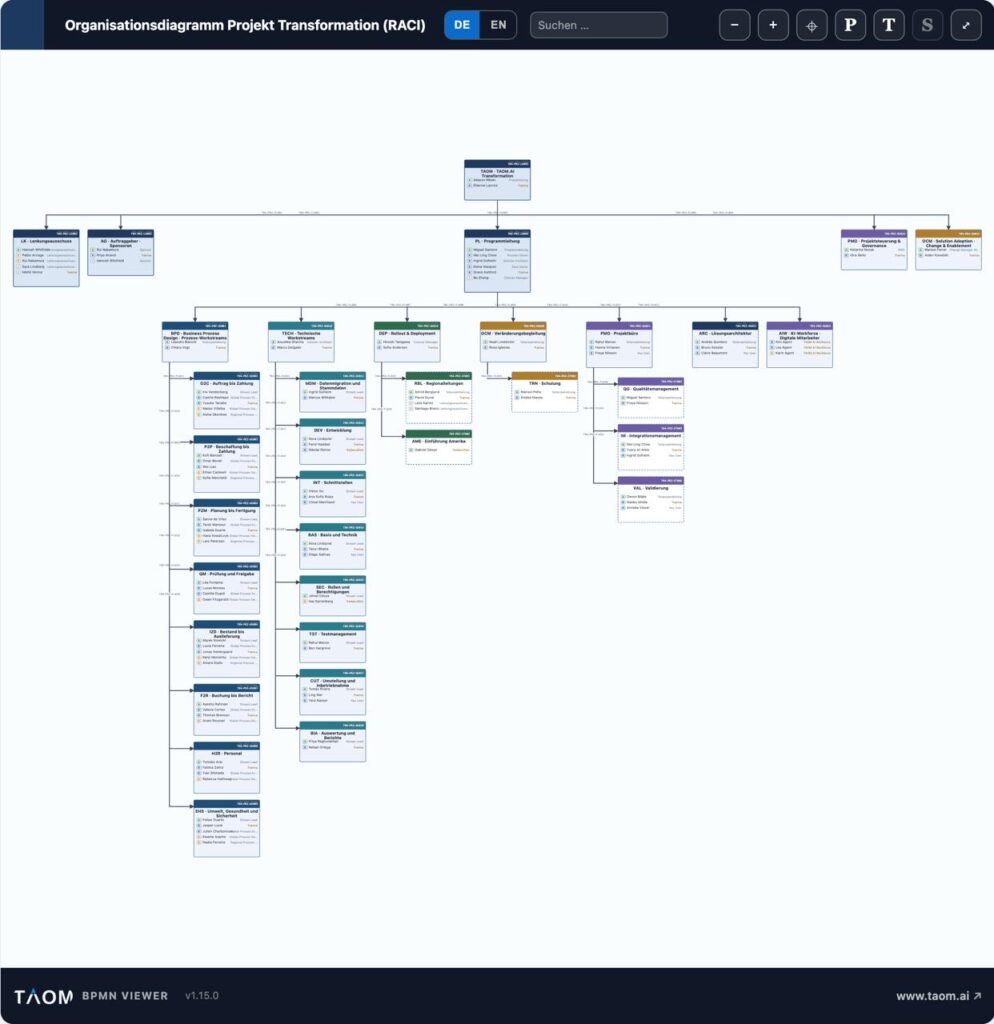
The chart below comes from a transformation programme: 35 units, 109 assignments, four levels. It was not traced by hand but generated from the model – and it is shown with our own viewer, the same one that runs inside Confluence.
Three things a picture cannot do
1. Have the responsibility confirmed
Whoever is entered into an organisation receives an e-mail and confirms it themselves – or objects. Until then the position stands as “open”.
A responsibility nobody has accepted is not a responsibility. It is an assumption.
If someone declines, the person who entered them finds out – with name, role and area, not with an e-mail address.
2. Search for gaps
Because the organisation is a model, it can be queried. Nine ready-made questions expose the typical weak spots:
| Question | What it finds |
|---|---|
| No accountable | Units where nobody carries an A |
| More than one | Two people with A on the same object |
| Responsibility outside | The A sits with an external provider |
| Informed only | Units where nobody acts |
| AI staff with an A | An agent given decision rights instead of execution |
This is not a report on the side – it is the reason the organisation is maintained as a model at all.
3. Carry digital staff along
AI agents take part in processes. In the model they are their own origin – identifiable, countable, auditable. One rule applies to them in particular:
An agent does not confirm for itself. Its owner is answerable for the deployment.
An A on an agent therefore raises a warning. R, C and I are permitted.
One model, four outputs
The same organisation leaves the tool along four paths – and none of them is a screenshot:
| Path | What arrives |
|---|---|
| HTML | a standalone page with the viewer, shareable by link |
| for printing and attaching | |
| Confluence | one page per unit, with elaboration and quality view |
| PowerPoint | real shapes, editable in the target program |
The presentation is the newest path – and the one that taught us the most. Embedding an image would have been easier. But whoever receives a graphic can change nothing: no moving a unit, no correcting a name, no rebuilding a slide.
That is why the export creates real shapes. Every box is a group – one click grabs frame, header bar, title and person rows together. After the overall picture comes one slide per group, followed directly by the elaborations of its units. What belongs together stands together.
What this changes day to day
The difference does not show on the day the chart is created. It shows three months later, when someone asks: Who was responsible for the data migration again?
With a slide, the search begins. With a maintained model the answer sits in the box – with the role, the confirmation date, and a note if nobody has confirmed.
In short
An org chart is the view, not the thing. What you maintain is responsibility: who decides, who is consulted, who has agreed. The picture follows from it – and can be queried, checked and passed on.
Read on: Responsibility & project organisation · RACI – who decides, who is consulted · Confirming roles instead of assigning them · Where nobody is responsible · Escalation and AI agents · One source, several target systems
Leave a Reply