One click from the report to the process step.
Reporting across all models below one node of the enterprise model: overview, Process Mining, project times, tests and risks. Every KPI, every bar, every heatmap cell opens the steps behind it.
Only what is actually there is counted – every total says what it adds up.
Everything held in the model – in one analysis
Each view is a tree of model, role and step. That way it stays clear where a number comes from.
Overview
KPIs as cards across all models of the node.
Process Mining
Times per time type, heatmap across steps and key figures.
Project times
Plan and actual per activity, stacked bars per role.
Tests and risks
Test status per step as Kanban: verification required without test case, open, failed, passed.
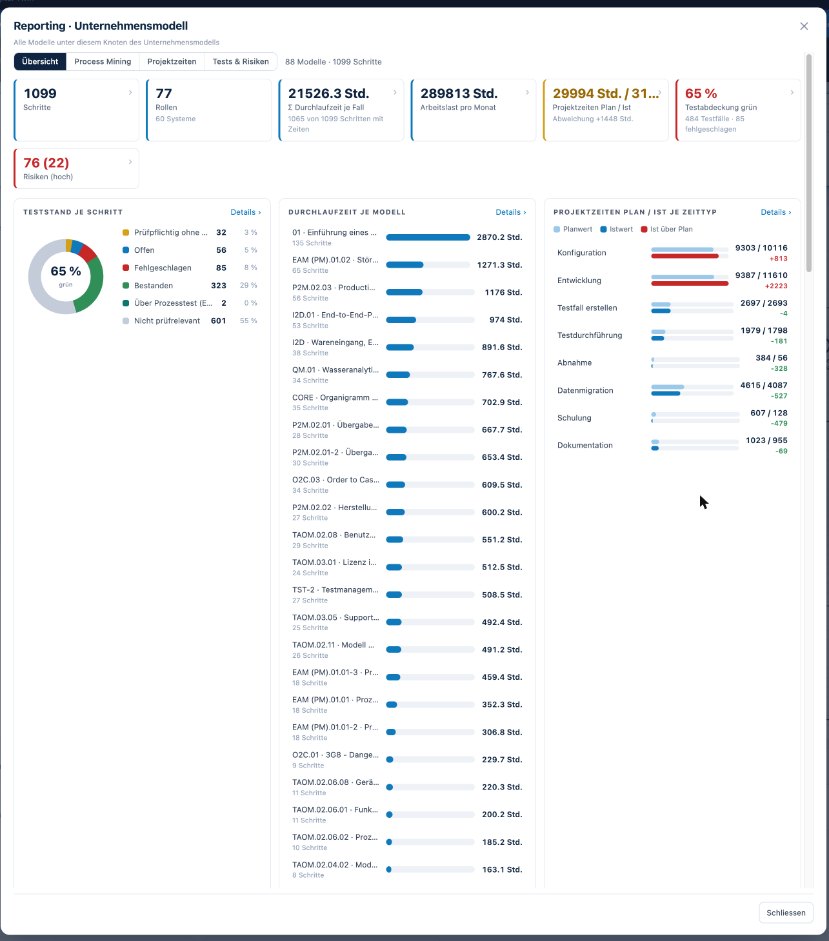
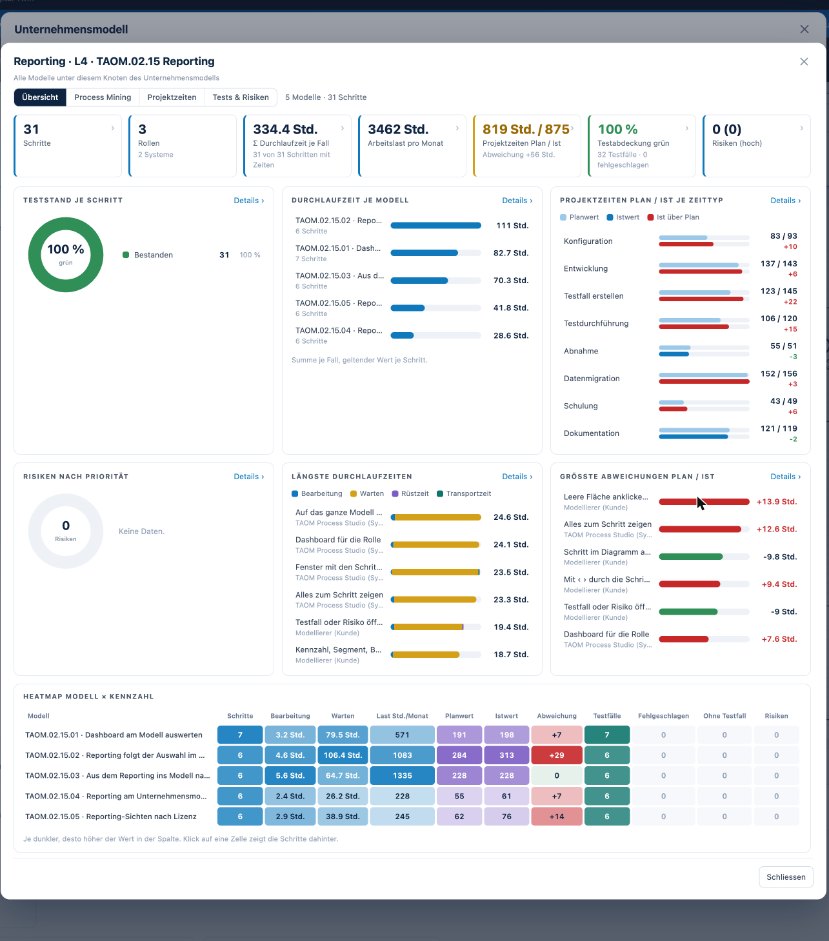
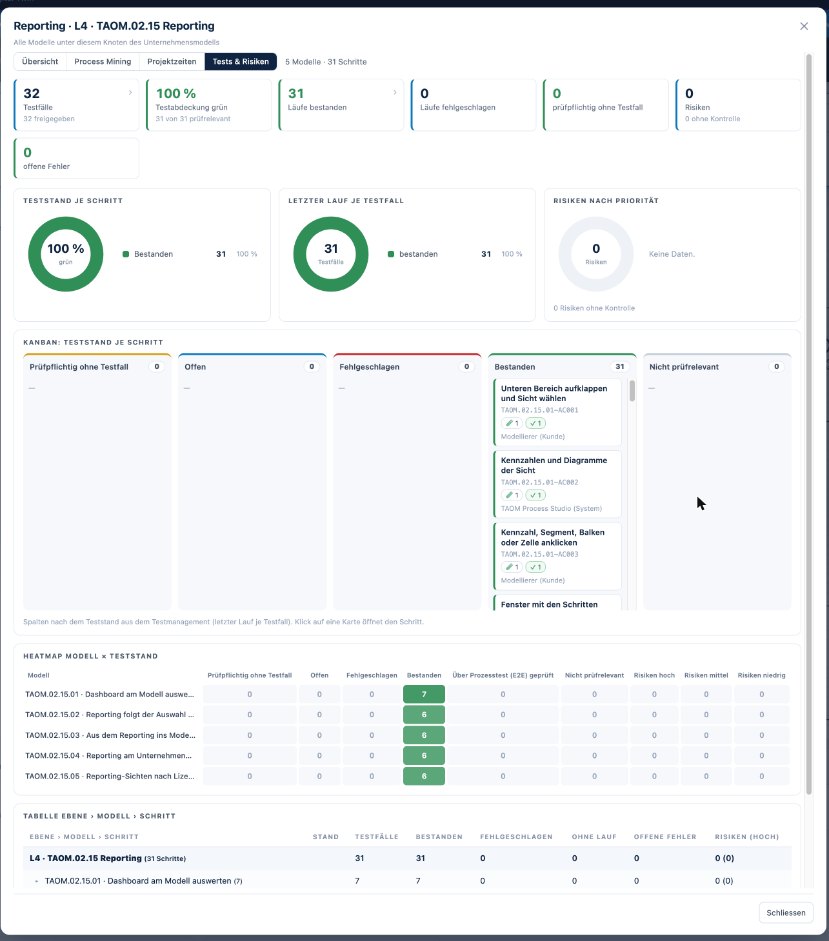
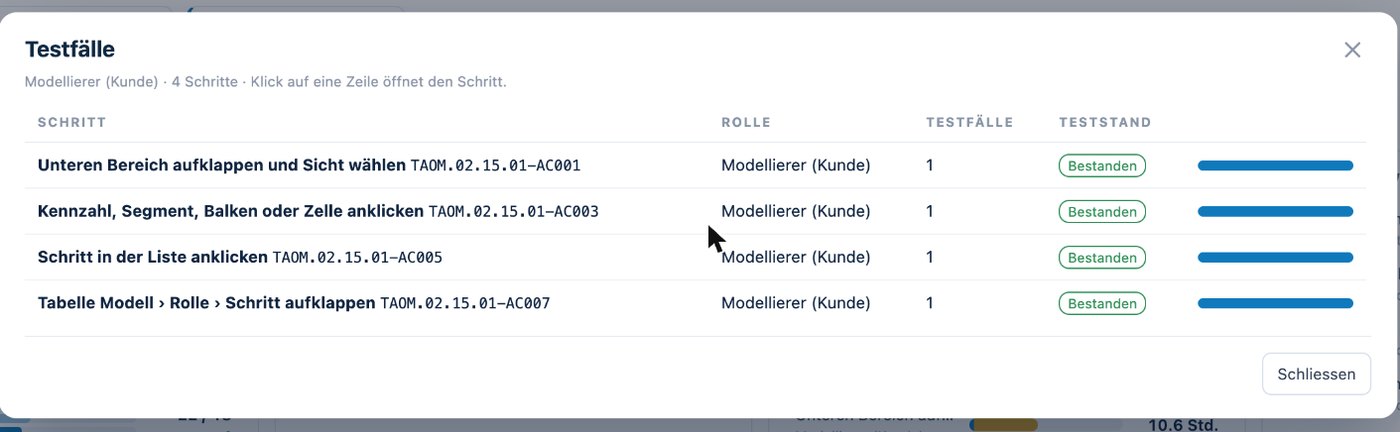
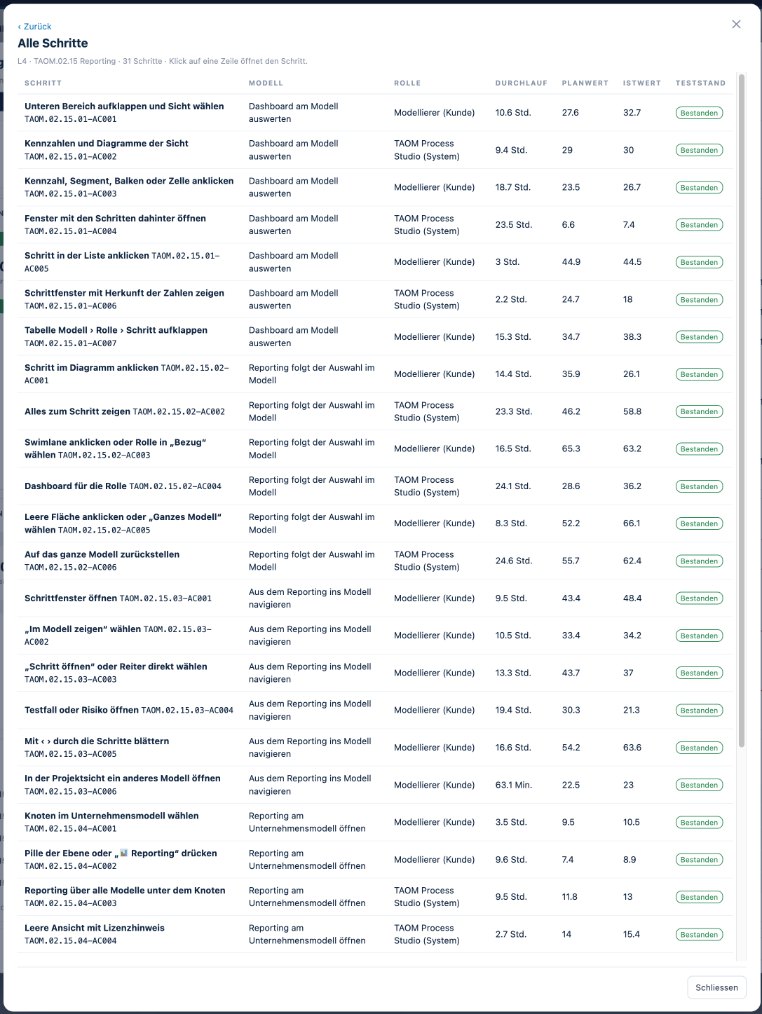
Screenshots from TAOM Process Studio with sample data. Click an image to enlarge it.
Not just see it – go there
A click on a segment opens a window with the steps behind it. From there you carry on – without losing the analysis.
What you won’t find elsewhere
BI tools show numbers. Process tools show diagrams. Reporting in TAOM shows both – and keeps them connected:
- Times, effort, tests and risks on the same step
- the same ID as in Jira and Confluence
- no data copy into a second system
- source of every number visible
This turns the process model into a digital twin of your organisation: processes, roles, systems, tests and KPIs in one place – always up to date instead of pulled together once a quarter.
Short answers
From which tier is reporting available?
The Reporting add-on licence can be purchased from Webuser Pro – see the licence structure.
Do I need Process Mining or Testing and verification for it?
No. Reporting shows what is held in the model. The Process Mining and Testing and verification add-on licences add their views with content.
Can I include data from other systems?
Interfaces to external systems are not included and are offered separately on request.
From the number to the step – and back.
Reporting add-on licence – from Webuser Pro, own term, cancellable separately.